The results panel lets you see graphs of results from the model simulations you've made. To open it:
From the Model menu, select Open Results panel
or
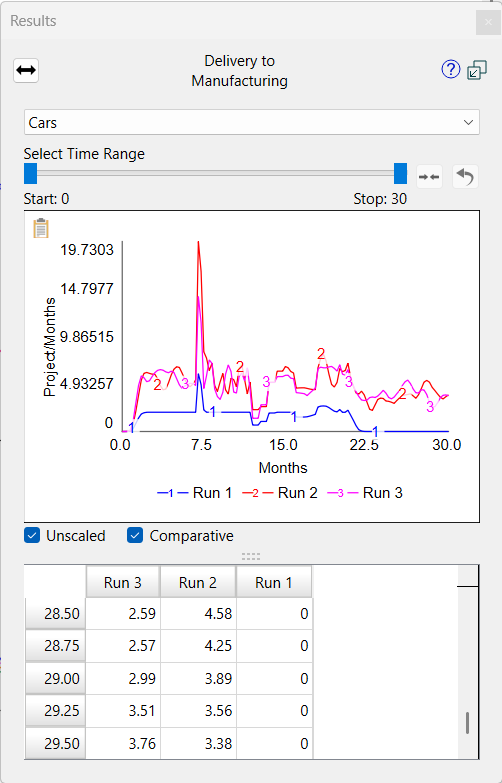
The results panel will open:
Unscaled, if checked, will cause the graph to display without trying to round the vertical scale. This is very helpful when looking at variables that have small variations over the course of a run.
Comparative, if checked, will show values from all the displayed runs. If it is not checked, stocks will be displayed as area graphs and flows, converters, and link scores as line graphs.
You can compare different variables in the results panel by selecting more than one (using Shift+Click or dragging):
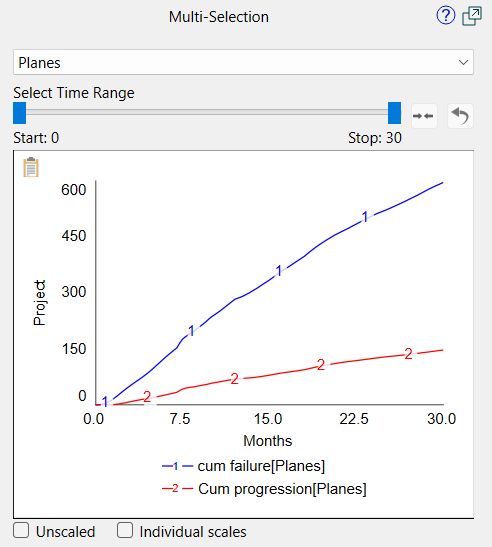
Unscaled, if checked, will cause the graph to display without trying to round the vertical scale. This is very helpful when looking at variables that have small variations over the course of a run.
Individual Scales, if checked, will show each variable (or link score) on its own scale. This is helpful when the values are very different between the selections (e.g. 10s and millions).
You can display more than one element of an array by selecting the final entry (All:Dimension name) in the dropdown for the dimension. This choice is only available when the Comparative checkbox has been unchecked:
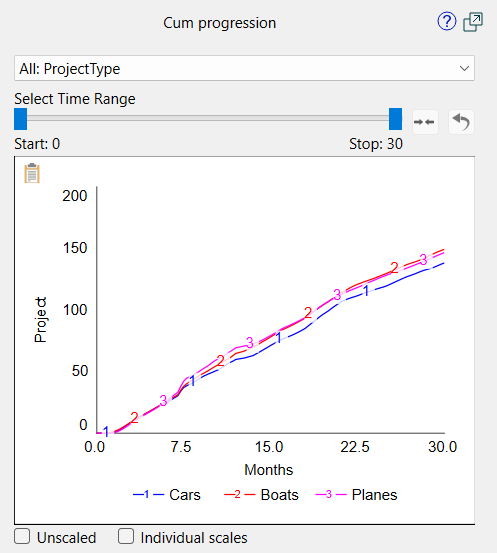
Unscaled, if checked, will cause the graph to display without trying to round the vertical scale. This is very helpful when looking at variables that have small variations over the course of a run.
Individual Scales, if checked, will show each variable (or link score) on its own scale. This is helpful when the values are very different between the selections (e.g. 10s and millions).
Note Your selection of All will persist if you select another variable with the same dimension.
Note The All selection is only available when you uncheck comparative.
You can set constant values in the results panel, as long as Show inputs in Results panel is checked in the Preferences Dialog and you're in Explore mode. When you select a constant (single selection), the panel will display an entry for the value.
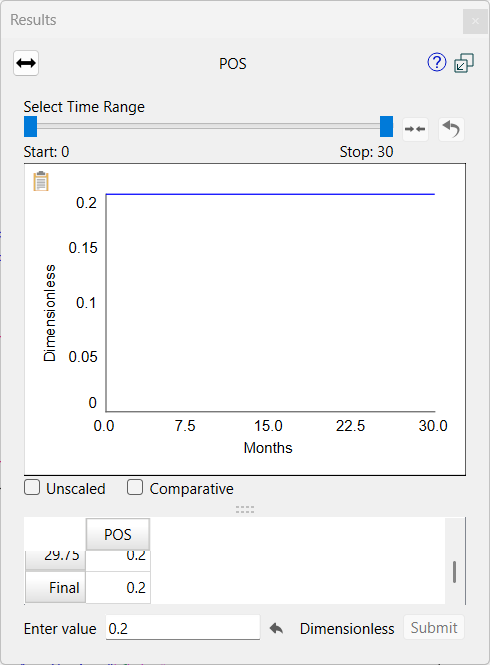
To change the value, type in a new value and click the Submit button (or press the enter key). To reset the value to the model equation value, click on the ![]() button.
button.
You can set graphical values in the results panel, as long as Show inputs in Results panel is checked in the Preferences Dialog and you're in Explore mode. When you select a constant (single selection), the panel will display a button to change the graphical:

Click on this to open the Graphical Editor dialog box and make changes. The changes will only be temporary and may will be removed when inputs are restored.